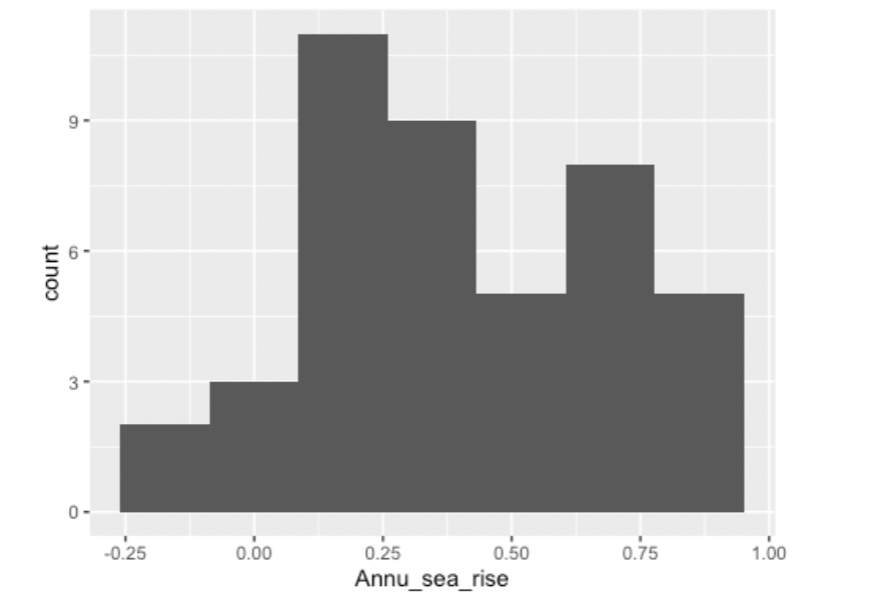
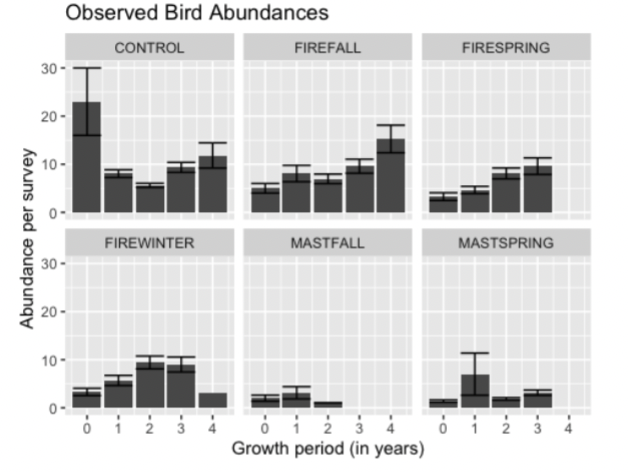
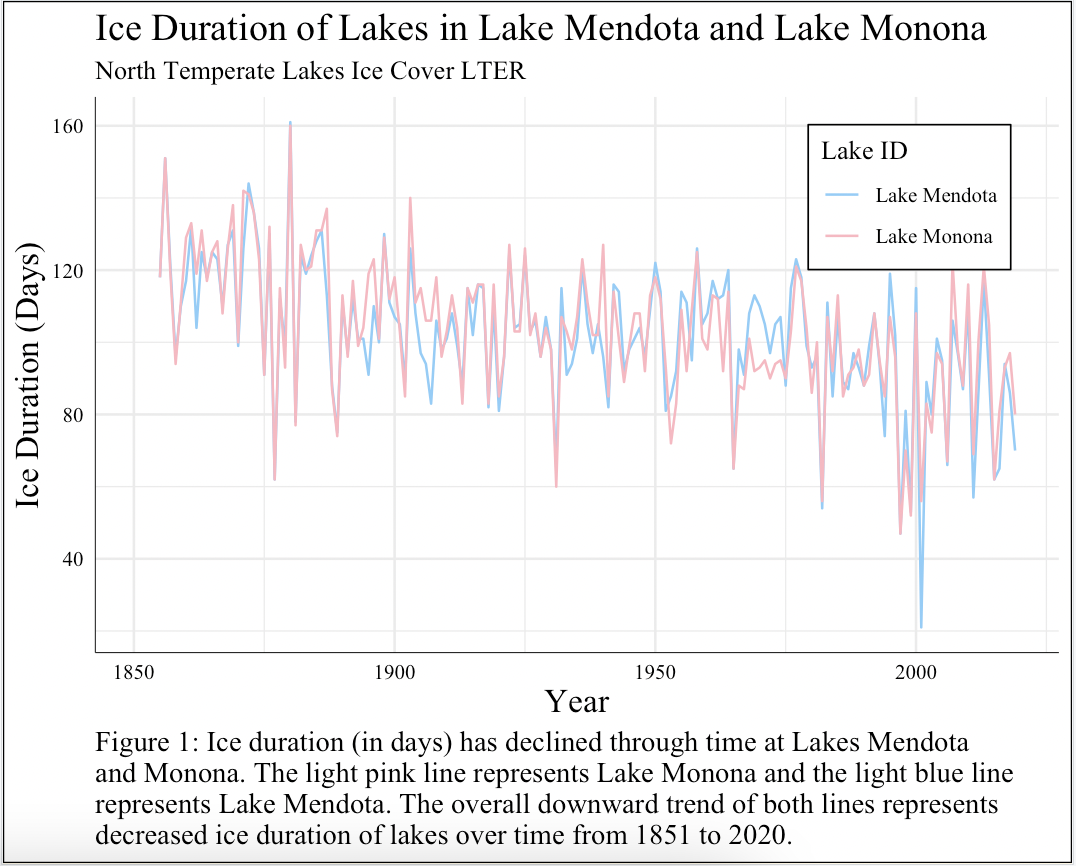
Coding Progress
Throughout my ENVS 193DS course (which I am taking right now), an environmental data science class, I have learned how to code using RStudio.
The process of coding has been difficult, however, I feel as though I have made significant progress, particularly in creating data visualizations. Below are some of the data visualizations I have created in chronological order, from the first visualization I created to my most recent.